Section 03 / Case Studies
Fusionex Case Studies: Measured Results From Data-Driven Transformation
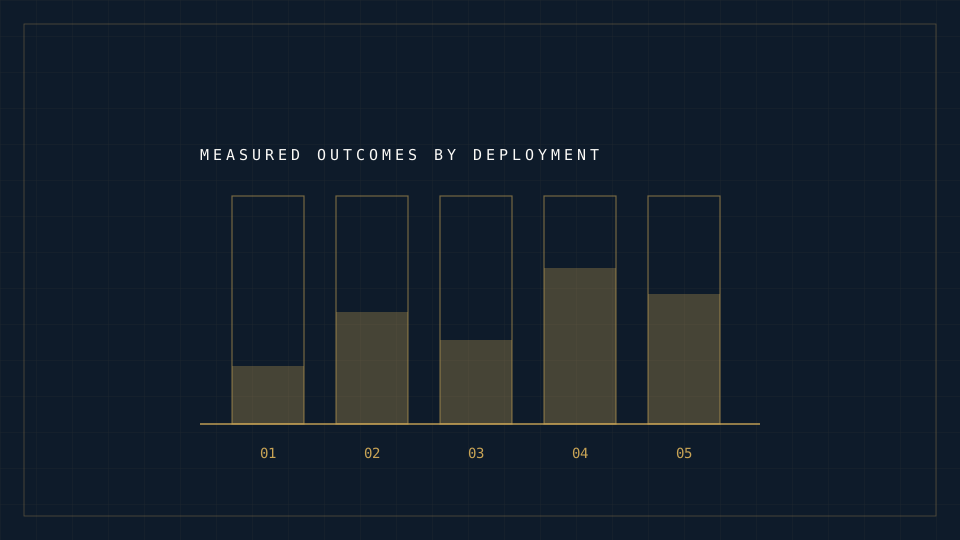
Five deployments, set out in the same structure each time: what was wrong, what was built, and what changed as a result.
Transforming Operations for a Leading Retailer
Challenge
Inventory was being managed without a reliable forward view. The result was the familiar pairing of stockouts on the lines that sold and overstock on the lines that did not, with lost sales at one end and tied up capital at the other. Customer preference data existed but was not structured well enough to direct marketing spend.
Solution
An analytics platform that combined live inventory tracking with predictive demand modelling, plus AI assisted customer behaviour analysis to give the marketing team something specific to target.
Result
- 30 percent reduction in stockout and overstock incidents.
- 25 percent increase in sales attributable to targeted promotions.
- Inventory management moved from reactive replenishment to planned positioning.
Improving Customer Experience for a Financial Institution
Challenge
Customers were leaving, and the institution could not see it coming. Engagement was undifferentiated and product offers were not matched to need, which meant retention effort was being spent evenly across a customer base with very uneven risk of departure.
Solution
AI driven sentiment analysis and predictive churn modelling to identify at-risk customers early, supported by real-time engagement metrics so that service teams could respond while the relationship was still recoverable.
Result
- 15 percent reduction in customer churn within six months.
- 20 percent improvement in customer satisfaction scores.
- Retention programmes targeted by risk rather than applied uniformly.
Using Data to Drive Growth in Manufacturing
Challenge
Production inefficiencies were creating delays and cost, and demand forecasting was weak enough that scheduling and supply chain planning were both operating on assumption rather than signal.
Solution
An end-to-end analytics deployment covering production scheduling and demand forecasting, with machine learning models predicting demand spikes early enough to support just-in-time inventory management.
Result
- 40 percent reduction in production delays.
- 30 percent improvement in inventory turnover.
- 15 percent cost saving from reduced waste and better supply chain sequencing.
Raising Marketing Return for an E-Commerce Business
Challenge
Campaign performance was being measured separately on each channel, which made total return impossible to calculate and cross-channel reallocation impossible to justify. The business was spending confidently and reporting vaguely.
Solution
A consolidated dashboard drawing performance data from social, email and search into a single view, with AI driven analysis recommending allocation adjustments per channel.
Result
- 20 percent increase in marketing return on investment through reallocated spend.
- 15 percent increase in customer acquisition from improved targeting.
- Campaign decisions made against live data rather than end of month reporting.
Improving Efficiency in Healthcare With Data Insights
Challenge
Long patient waiting times, overburdened staff and no reliable way to anticipate patient inflow. Resourcing decisions were being made after the pressure had already arrived.
Solution
An analytics platform forecasting patient inflow from historical patterns, allowing resources to be allocated ahead of demand, together with AI assisted scheduling to smooth staff workload.
Result
- 20 percent reduction in patient waiting times.
- 25 percent improvement in patient satisfaction.
- More even workload distribution across clinical and support staff.
What the Five Have in Common
Read together, the pattern is more instructive than any individual result. In every case the underlying failure was the same: a decision was being made on a lagging signal, or on no signal at all. The technology varied. The correction did not.
It is also worth noting what none of these cases show. None of them was solved by a more sophisticated model alone. Each required the data to be reconciled first, the platform to be usable by the people who owned the decision, and the organisation to agree in advance what it would do differently once the insight arrived. That sequencing is the actual work.
Frequently Asked Questions
Short answers to the questions this page is most often asked.
Which sectors do these Fusionex case studies cover?
Retail, financial services, manufacturing, e-commerce and healthcare. Each is presented with the same three-part structure: challenge, solution and measured result.
What kind of results did Fusionex deployments produce?
Documented outcomes include a 30 percent reduction in retail stockouts, a 15 percent reduction in financial services churn, a 40 percent reduction in manufacturing production delays, a 20 percent increase in e-commerce marketing return and a 20 percent reduction in patient waiting times.
Are the clients named?
No. The deployments are described by sector rather than by client name, which is normal practice where commercial confidentiality applies to the underlying engagement.
What did these projects have in common?
In every case a decision was being made on a lagging signal or on none at all. The correction involved reconciling the data first, making the platform usable by the decision owner, and agreeing in advance what would change once the insight was available.
Does a better model alone solve these problems?
No. None of the five was solved by model sophistication on its own. Data reconciliation, platform usability and organisational readiness carried more of the outcome than the modelling did.
Behind the numbers
The reasoning that produced these results is set out in the mission and vision, and in the company's approach to industry-specific design.
Read the approach